Visual Studio Add-Ins: DPack

DPack is an add-on I’ve used for quite some time, coming in both VS2003 and VS2005 versions. Available from USysWare (http://www.usysware.com/dpack/) this add-on has a wide variety of tools including Code Browser, File Browser, Solution Browser, Framework Browser, Numbered Bookmarks, Surround With, Code Navigation, Solution Statistics, and Solution Backup.

Some of the items, like the browsers have some overlap with other tools mentioned already. For example, I find the solution browser from Microsoft (see my previous post) easier to use. However, the DPack browsers add a lot of useful statistics that the other tools don’t.

Surround With is probably the tool I use the most. Right clicking highlighted text and picking Surround With produces a pop up window.

[Picture of DPacks Surround With feature.]

As you can see here, I selected for from the list:

[Pic of Surround With in action.]

Solution Backup is another tool I use frequently. Whenever I reach a milestone in my code, such as completing a bug, I use Solution Backup to take the entire project and save it to a ZIP file.

Take a look at the website, USysWare has some good demonstrations and snapshots of the tools included in the pack. Like the other tools, it’s totally free, so worth adding to your toolkit.

Visual Studio Add-Ins: MS Visual Studio Enhancements

The next add-in I guess technically isn’t an add-in, since it doesn’t reside in the Add-Ins window, but it’s close enough. Coming from Microsoft itself, this handy download is named Visual Studio 2005 IDE Enhancements, but I notice the file name is vssdk_powertoys. Cool.

You can download this set of five tools from http://www.microsoft.com/downloads/details.aspx?familyid=cd7c6e48-e41b-48e3-881e-a0e6e97f9534&displaylang=en or http://shrinkster.com/jwx .

The first, and incredibly useful tool in this free add-in is the Source Outliner. Seen in the window below, it builds a source tree that resides in a window with the toolbox and server explorer. To activate, click on View, Other Windows, Source Outliner.

You can quickly and easily navigate through your project using the tree. On a large project or class this will be very useful, I can tell this is a tool that will get a lot of work out in my environment.

[Picture of Source Outliner]

Next is a collection of Visual C++ snippets. Great if you’re a C++ guy, just sort of there if you’re not.

Third is something they call Indexed Find. This uses the Microsoft Index Service to provide advanced search capabilities. You indicate what you want to look for, what directory (or directories) to look in, file types, and away it goes.

I can see where this would be handy, let’s say you have another project that you know you’ve written a routine in, but can’t recall which file it’s in. Whip out this handy tool and let it look for you. Like the other tools here, it’s available via the View, Other Windows menu.

Fourth up is the Super Diff Utility. Just what you’d expect from the name, it will let you specify two source files and does a compare, highlighting differences. Very handy when you want to look back upon a previous version you’ve pulled from your source repository, or perhaps you’ve got conflicting versions on different disk drives and want to determine which you should be using.

The final tool in the pack is the Event Toaster Utility. Unlike the other tools, this one is access via the Tools, Options dialog. Down in Power Toys, EventToaster you can see a list of VS events you can hook into.

[Picture of EventToaster.]

As you can see, there are a wide variety of tasks you can launch, from something as simple as a sound to something as complex as a macro.

Microsoft has done a nice job with these tools, extending the Visual Studio IDE in some very useful ways.

Visual Studio Add-Ins: SlickEdit Gadgets

We’ve spent a while talking about tools you can use outside Visual Studio to help you with your application development. It’s time now to look at some tools we can use inside Visual Studio.

First up is a brand new set of VS Add-Ins from SlickEdit (http://www.slickedit.com/content/view/441), called SlickEdit Gadgets. This free add-in comes with five tools: Editor Gadgets, Command Spy, File Explorer, Data Object Analyzer, and the SLOC Report.

The first tool, Editor Gadgets, contains four useful items. First, there is an Indentation Guide that draws a line down the screen at the current indent level for your cursor. Next is a Line Ruler, that highlights the current line and displays the tab settings. Both of these are illustrated in the following graphic:

[Indent and current line bar tools.]

Third is a very useful feature called Auto-Copy. When text is selected with the mouse, it’s automatically copied to the clipboard. To paste, click with the middle button (or scroll wheel, if you have a clickable scroll wheel).

The final option is the ability to place a graphic over the editor window. In the example on their website they have a green bar paper image behind the editor text. These various features can be enabled and disabled via the options window inside Visual Studio. For example, I thought the blue background and black border on the Ruler Line to be distracting, so I reset to a white background and light gray border.

[Muted bar.]

As you can see, much less distracting. I also opted to turn off the indentation line.

Next up is the Command Spy. If you are a VS Macro writer, you’ll find this tool indespensible. Command Spy is a small window (you can dock it with the Output and other windows). As you activate various commands in VS, Command Spy shows you the command in the window. Again, very useful if you want to write macros.

The third is what I consider to be the most useful tool, right behind Auto Copy: File Explorer. It’s just what it sounds like, it puts a File Explorer tab into your VS environment.

[File Explorer Tool]

You can then drag any of these items into your project solution window. I can see where this handy tool will get used a lot.

Next up is the Data Object Analyzer. This tool lets you examine what you put on the clipboard, see it’s properties, and generate code to handle it. How useful this will be remains to be seen, if you find creative uses for it feel free to post a comment.

The final tool in this free kit is the SLOC report. SLOC stands for Source Lines of Code, it creates a Pie Chart style report that shows you the ratio of comments, white space, and actual lines of code. You can run the report for individual files or entire projects.

This can be handy if you need some quick statistics, perhaps you are doing a code review and want to be sure the ratio of code to comments is respectable. Most times though you won’t find this tool all that useful.

One thing to note, it only works with VS 2005, if you are still in the 2003 environment you’re out of luck.

There you go, a new tool from Slick Edit that’s free and adds several useful features to Visual Studio. Please leave a comment, I’m curious what your favorite features are and how you are using the tool.

SysInternals – The New Process Monitor

Just when I thought I was done talking about the SysInternals tools, Microsoft finally integrates them into their TechNet site and makes some changes. I’ve already mentioned a few in my last post, in this one I wanted to take a quick look at the new ProcMon.

Available at http://www.microsoft.com/technet/sysinternals/ProcessesAndThreads/processmonitor.mspx, the new Process Monitor (ProcMon) replaces two older tools, FileMon and RegMon. It will keep an eye on all disk activity, whether it be on the drive or the registry. In the example below you can see what’s going on in my system as I write this. For example, I have WinAmp playing a recent DotNetRocks episode.

[Picture of Process Montiors main UI.]

One feature I rather like is the Process Tree, under the Tools menu.

[Process Monitors Process Tree]

Here you can see some of the many programs I have running. All I have to do is click on one of them then click the Go To Event button and it will take me right to the event. Three buttons on the main toolbar make it very easy to filter down to the events you want to see.

[Handy tools in the ProcMon Toolbar.]

The leftmost button turns registry events on or off. The middle button shows or hides file system activity. The right most button toggles the display of process / thread activity. Other filters allow you to narrow down to specific files or events you want to monitor.

I like the new version of this tool, lots of new features that make me prefer this to the older FileMon/RegMon tools, which are still available if you want to do your own comparisons.

SysInternals – Update – Microsoft Merger Complete

Since I began my posts on SysInternals, I’ve found they have now gone completely Microsoft. The SysInternals URL now redirects you to a Microsoft TechNet page, http://www.microsoft.com/technet/sysinternals/default.mspx. All of the tools seem to be there, with a few minor changes.

The Process Monitor (ProcMon) tool has been renamed to Process Explorer. Other than that, it still seems to have the same capabilities, and they’ve made sure it works on Vista and the 64 bit Windows platforms.

Update: Seems I got confused over tool names, Process Explorer was always Process Explorer and not ProcMon. That’s what I get for writing blog posts at 2 am. Except for getting names confused, all the other details I point out are still accurate, good tools well worth the look.  Oh, and ProcExp does work on the Vista (32 and 64 bit versions).

There’s a new tool called Process Monitor that replaces the older FileMon and RegMon tools (although both of them are still available). The new ProcMon seems to give much the same info in a unified user interface. I admit it is nice to have all the info in one screen.

Take a look over the tools and feel free to post comments below on how you feel about the new features and the Microsoft revamp of the tools.

SysInternals – ZoomIt

The last tool I am going to present in this series (although certainly not the last tool available from SysInternals) is called ZoomIt. Zoom it allows you to zoom in on certain areas of the screen with one quick hit of a hotkey. The hotkeys are configurable, as you can see in the options dialog below.

[Picture of ZoomIt Option Dialog]

Once you activate the zoom, you can use the up and down arrows to change the level of magnification. The ESC key will exit the zoom functionality. You can also use the Draw feature to Draw on the screen, great if you are doing a net meeting or demonstration and want to highlight something.

Primarily this utility comes in handy during demos and meetings, but I’ve also found it useful when working on images for my app and need to look at a detail or two. Also handy for documentation, I have used the Draw feature to draw on the screen, then used Print Screen to snag the image and send to someone, as in the example below.

[Demonstration of ZoomIt's Draw feature.]

So give it a try, drop me a comment and let me know what creative uses you come up with for this handy tool!

SysInternals – ProcExp

If there was one of these tools that would make you drool, then this would be it. ProcExp is a process explorer that gives you all sorts of details about the jobs running on your system. After running it the first time, right click on the column bars and pick “Select Columns”, then add a few more useful columns. The most useful of these would be Path, which shows the disk location the exe or dll launched from. Version is also useful, you may find more that have meaning for you.[Picture of ProcMon basic view.]

Next, select View, Show Lower Pane. Then select View, Lower Pane View, and pick DLLs. OK, now here’s something really cool, especially for you .Net developers. See the image above, there are two processes that are highlighted in yellow. The yellow (and these colors are customizeable) indicates this is a .Net application. You can see I have two .Net apps, RSSBandit and PaintDotNet. Click on one of the yellow bars (in this case I picked PaintDotNet). You’ll see the lower pane populate, as in the picture below.

[Pic of ProcMon with it's lower panel showing some useful information.]

What you are seeing is a long list of all the DLLs loaded by your app. Way cool huh? You can see all the dependencies needed by your (or someone elses) program. Cool, but there’s more! Double click on the app line (again, the yellow line with PaintDotNet).

[Pic of dialog showing more information about the application you clicked on.]

You can see a new dialog with detailed info about the program. You can kill off the program, or bring it to the foreground. There’s lots of tabs you can click on, I’ll highlight a couple of the most useful ones. Click on the Performance Graph tab.

[Picture: Try not to drool as you look at this useful graph.]

This produces graphs similar to the ones Task Manager gives you, only this is targeted at just this particular app. Great tool for monitoring your program, looking at memory usage, CPU usage, etc. The Performance tab gives you similar information, only in a textual view.

Now go click on the .Net tab. You can see a list of the AppDomains. Click on the drop down (shown below) and you can see a list of the various performance counters you can view.

[Picture: Your like a kid at Christmas as you look over all the stats you can dig out of your .Net app.]

Lots of great info in this area, below I’ve pasted the Memory stats, just to give you an idea.

[Picture: Shows you just how much memory your app really needs.]

There’s more info to be found here than I can describe in this brief blog post. Take some time, dive in and look around. This tool can really assist you in determining the impact your application will have on the target system.

SysInternals – Two Monitor Programs

Nov. 9th Update:Microsoft has completed the merger of SysInternals into it’s internal TechNet area. Along with that they’ve renamed the old Process Monitor to Process Explorer. They have a new Process Monitor tool that combines the functionality of the two tools I mention below. Both tools below are still available, but you should also take a look at the new Process Monitor to see if it will better suit your needs.


How many times have you watched your hard drive light flicker and wondered “What the heck is banging my hard disk?” Well FileMon will help you figure this out. FileMon simply displays all the applications that are accessing your drives.

[Picture of FileMon.]

As you can see in the sample above, you can monitor all the items that are reading and writing to your disks. You can use filters in case there’s a particular program or programs you are interested in. The filters are nice in that you can use either includes (I only want to see…) or excludes (I want to see everything but…). Additionally you can save the output to a log so you can analyze it later.

Along the same lines is RegMon. RegMon is a Registry Monitor that will give you info on what is accessing your registry. Like FileMon there are filters and logging capability.

[Picture of RegMon.]

Two great monitoring tools to help you with debugging, and like all the SysInternals tools, free for the taking.

SysInternals – BgInfo

I work in a lot of Virtual PCs and remotely controlled pc’s via Remote Desktop. It’s gets confusing at times determining which PC I’m working in, especially when I step away for more coffee/hot tea or am interrupted.

BgInfo has really helped with this issue. It takes your current desktop (in my example I just have a plain black background) and overlays current system info, as is seen on my desktop below.

[Picture of my desktop with BgInfo's information on it.]

You can pick and choose the details you want to display, and reorder them in any order you want, using the interface.

[Picture of BgInfo's configuration screen.]

You can also configure BgInfo to run at every startup, or launch it at your convienience. In my normal day to day setup I selected half a dozen of the most useful items to display, but for my example above I left everything in.

Again, a very useful tool if you are in and out of virtual or remotely controlled machines every day.

SysInternals – Contig

Along the same lines as PageDefrag is Contig. Contig is a command line utility that will allow you to defrag a single file or group of files, instead of having to defragment your entire disk. Here’s the command line help:

Contig v1.53 - Makes files contiguous
Copyright (C) 1998-2006 Mark Russinovich Sysinternals - www.sysinternals.com

Contig is a utility that relies on NT's built-in defragging support to make a specified file contiguous on disk. Use it to optimize execution of your frequently used files.
Usage:
contig [-v] [-a] [-s] [-q] [existing file]
or contig [-v] -n [new file] [new file length]
-v: Verbose
-a: Analyze fragmentation
-q: Quiet mode
-s: Recurse subdirectories

Usage is pretty simple, just type in Contig followed by the file (or file spec, such as *.mdb) you wish to defragment. This can be useful if you have some larger database files or other files to process that are running slowly. Use contig prior to running your large jobs and you’ll see a nice speed boost.

Also useful if you just want to see if your file is fragmented, just add the –a switch prior to the file name and it will tell you how many pieces your file is fragmented into.

Note, with all these tools you use at your own risk. Always make sure to backup important files prior to running any of these tools on them.

SysInternals – PageDefragmentor

Next up is another startup tool, PageDefrag. As we all know, Windows relies heavily on it’s PageFile.Sys to manage memory. When your pagefile gets fragmented, performance can really take a hit.

Page Defrag will let you tell windows to defrag your system files the next time you boot, or everytime you boot. As you can see below my pagefile is not fragmented, but you might be surprised by yours. Give it a try, you might be startled at the performance boost you get.

[Picture of PageDefrags user interface.]

SysInternals

Scott Hanselman (http://www.hanselman.com/blog/) recently got with Carl Franklin (http://www.intellectualhedonism.com/) on Dot Net Rocks Episode 35 (http://www.dnrtv.com/default.aspx?showID=35) for an hour long presentation on the great tools from SysInternals (http://www.sysinternals.com/).

SysInternals is a collection of freeware tools that allows you to extract some really great info from the Windows OS, or adds some nifty extra utilities. If you don’t have an hour to invest right now, or are bandwidth impaired, I thought it’d be useful to spend a few blog posts talking about these tools.

One great feature of all the SysInternals tools is that none of them require installation. They can all be run without leaving footprints on the host system. I keep them on my USB thumb drive, so I can quickly and easily diagnose issues on users PCs.

A quick note, the parent company of SysInternals is WinTernals. WinTernals was recently purchased by Microsoft (shows you how cool the tools were). Soon many of the WinTernals / SysInternals tools will have Microsoft labels on them. Microsoft has pledged that SysInternals tools will continue to be free. Check the SysInternals blog for updates on the tools as time goes by.

To start things off, we’ll talk about a tool that helps you with your computer’s start up. Autoruns lets you examine everything that your computer launches. You can look at everything at once, or handy tabs let you look at it by category.

[Picture of AutoRuns user interface.]

Clicking on an item will populate the window with info about that item:

[Picture of the information area of the window.]

Want to learn more about an item? Right click on it, and select Google from the menu. Autoruns will launch a Google search in your browser of choice on the program in question, letting you learn more about it, to determine if you actually need this piece of software to load in your system.

If you decide you don’t want it, simply uncheck the box. Next time you boot that particular software won’t load. Discover you need it? No problem, simply launch Autoruns again and check it on, reboot and all is well. Autoruns preserves all of the settings you had on the auto launch so it can easily be restored.

If you happen to have the SysInternals Process Explorer tool (I’ll blog about this shortly) you can actually see how much memory, etc. the particular item is taking up.

I like this tool, it’s simple, and focuses on one thing, controlling what starts automatically on your pc. Easy to use, and it’s free!

Virtual PC and Laptops

It’s been a crazy week here in the land of Arcane Code. Lots of traveling during a business trip, then the mad rush to take care of all the issues that arose while I was gone. I wanted to share a quick tip with you, now that you’ve had a chance to install and use Virtual PC.

If you run VPC on a laptop, as I do, you may have noticed some weird quirks especially when your laptop goes into Hibernate mode. Mostly the VPC becomes unresponsive, or in my case the main screen quits updating. Oddly enough the tiny icon window inside the VPC Console updates fine, but the big window doesn’t. Go figure.

Microsoft released a HotFix for this, but it didn’t get a lot of publicity. I found it buried in Virtual PC Guy’s weblog (http://blogs.msdn.com/virtual_pc_guy/archive/2006/07/13/662538.aspx). Since it’s brief I’ll regurgitate it here, in case you are a cautious type about link clicking.

I think the reason the hot fix is hard to find is because you already have it. Go back to the directory where you exploded the Virtual PC 2004 file. In addition to the Setup.exe, the MSI and INFs you’ll also find a directory called “Laptop Hotfix”.

In this directory is a text file that looks mostly like a license. However, at the top of the file is a link to the knowledge base article (http://support.microsoft.com/?kbid=889677) that describes a few of the nasties that this patch repairs.

What’s really important though is the MSP file. Just double click on it to install, and it should patch your system. If you are running a laptop, or regularly use the Hibernate or Standby features of your computer then you need to apply this patch.

I haven’t seen mention of this if you are running Virtual Server 2005, so perhaps they already included the fix there. If someone knows otherwise feel free to leave a comment.

Using and Tweaking Virtual PC

Once your Virtual PC is up and running, you may want to tweak a few of it’s settings. Let’s go over the menu options available to you.

Action Menu

This menu is fairly straight forward, and lets you initiate certain actions.

Full Screen Mode: Just what it says, shifts your OS into full screen mode.

Ctrl+Alt+Del: Sends the Ctrl+Alt+Delete sequence to the virtual OS instead of the host OS.

Pause: This places your OS into a stasis mode. This can be useful if your host system gets overloaded and you need to free up some resources. Note that it doesn’t close the window, merely suspends it.

Reset: This is the equivalent of yanking the power plug, then plugging it back in. You should only use this in extreme cases where your virtual OS is locked up.

Close: This brings up a small dialog window that asks if you wish to Save State or Turn Off. Turn Off is similar to Reset, in that it just stops whatever was going on and dumps the VPC from memory. Like Reset, you should only use this in extreme cases. Save State is very similar to the Hibernate mode in Windows, it puts the virtual OS into a suspended state.

Install or Update Virtual Machine Additions: This will install some very useful tools into your Virtual OS. These additions will make it easier to use the mouse (no more having to hit Right Alt to get your mouse out of the window). It will also allow you to share your host computers hard disks with the virtual computer. To the virtual computer they will appear as a network drive. If you use windows as a virtual OS, you’ll definitely want these additions. Be aware though that virtual additions also exist for many Linux distros.

Properties: Displays a four tabbed dialog that will give you info about your running virtual computer.

Edit Menu

Most of the items on the edit menu are pretty obvious. Copy, Paste, and Select All do just what they say. The real gem is Settings, which lets you tweak your VPC settings. I will focus on it shortly.

CD Menu

Your CD menu will vary depending on how many CD/DVD drives you have in your machine. All will start with Use Physical Drive and let you access your computers CD/DVD drive to do common tasks like load software or listen to your favorite tunes.

Also on the menu will be a Release Physical Drive for each drive you are using. When you no longer need the drive, you can click Release to free it up. There’s also an Eject CD option to pop the CD out without releasing use of the drive.

Capture ISO Image will let you take an ISO file, and treat it as if it were a real CD or DVD. This is quite useful for all those ISO images you wind up downloading from your MSDN subscription. (For those unfamiliar, an ISO is a CD or DVD disk image. You can use software such as Nero, Sonic, etc. to take the ISO and turn it into a CD full of files. )

BUG ALERT!!!! VPC has an issue with this Capture ISO Image command. There is a size limit of approximately 2 gig. If the ISO is bigger than that, VPC will fail but give you some really odd errors.

To get around this, in the host OS you can first mount the ISO like I describe in my September 13th blog post (https://arcanecode.wordpress.com/2006/09/13/virtualization/) then, using the machine additions, share the drive.

Floppy Menu

The commands under Floppy are almost identical to those in CD. I can’t recall the last time I used a Floppy, heck my last two computers don’t even have floppies, so I suspect this isn’t a command you’ll use much. But just in case, it’s there.

Help Menu

The Help menu has three commands, Virtual PC Help brings up the help file. Virtual PC Online takes you to the Microsoft site for VPC. Finally, About Virtual PC brings up a dialog displaying the version number and other info about the virtual environment.

That wraps up the menus, now let’s talk about Settings.

Settings

Accessible from either Edit, Settings or the Settings button on the Virtual PC Console, this dialog is where the real power resides to tweak your VPC. Let’s take a look at some of the more useful options.

File Name: Lets you rename the virtual machine. Sort of useless since you can do it from the OS, but what the heck.

Memory: This can be useful, in various ways. First, you can test your application to see how it performs under various memory conditions. Second, you may discover you’ve set your VPC too low. Finally, you may shift your VPC from one host computer to another, and the new host may not have as much ram (or more!).

Hard Disk 1..3: These will let you assign a virtual hard drive to a virtual computer. When you copy an existing VPC to create a new one, you’ll want to open up the settings and point to the new VHD, otherwise you’ll wind up still accessing the old one, which more than likely isn’t what you want.

Undo Disks: When enabled, this will write all changes you make to a VPC to an undo disk. When the session is over (i.e. you turn it off or reboot) you are asked if you want to commit your changes or discard. If you commit, your changes are placed into the VHD as you normally would without undo disks.

However, if you elect to discard, then the changes are thrown away. Your VPC is reset to the same condition it was when you first started. This is quite useful if you want to test install programs, to make sure everything installed correctly but don’t care about it after that. It’s also useful for training environments.

Networking: Under networking you can select which network card in your real, host computer to give the virtual machine access to. For example, my laptop has both wireless and wired networking, and through this option I can select which one to use (or I can select both). This mode is known as Virtual Networking.

In addition to Virtual Networking VPC also supports three other modes. Not Connected is pretty obvious, you are not allowing any network access. Local Only is used when you want to communicate with other virtual machines on the same host machine. This can be useful when you need a virtual pc to act as a client talking to a virtual server.

Finally, VPC has a mode called Shared networking (NAT). This is useful when you are using a dial up connection. Each VPC gets it’s address from a temporary, internal DHCP server. It then communicates to the internet via the host computer, which handles the network address translation. This is very similar to the way your home router talks to all of the computers on your home network.

Mouse: Once you install the machine additions, by default the mouse has pointer integration turned on. This is pretty simple, when you drag the mouse into the area of the window occupied by the VPC the mouse automatically is captured and used in the VPC. When you drag it out, it releases it.

There are a few cases where you may want to turn it off, such as when you are using a software KVM such as MaxiVista with it.

Shared Folders: Through shared folders you can access physical drives on your host computers environment. While this may seem quite convenient, you need to be careful. Opening up your host system to the virtual environment can present a security risk. If your virtual environment should get infected, that infection can spread to your host OS via the shared folders.

If you do choose to share folders (and sometimes you do need to), it will appear to your virtual OS to be a network drive. Normally this is no biggie, but be aware it can cause some trust issues with Visual Studio when attempting to open projects. I’ll post a fix for this later…

Tweak away

Hopefully now you have a good understanding of not only how to setup a Virtual Computer, but how to tweak the settings in VPC to make it do what you need. Don’t be afraid to experiment, change some settings and see what effect it has! (Just be sure to back up first!)

Virtual PC Step by Step

Update: April 10, 2008 – While the instructions below are still valid, I’ve created a new version of this post for Virtual PC 2007. And it’s in Video! Take a look at my post for
April 10, 2008 – Virtual PC 2007 Step by Step – The Video!

Update: April 22, 2008 – There’s a second video now showing the advanced settings. Some good info that adds to the scope of what’s here. Check out my post for
April 21, 2008 – Virtual PC 2007 Step by Step – The Advanced Settings Video!

OK, you’ve downloaded Microsoft Virtual PC (here after referred to as VPC) and installed it. The first time you run it, you see the display below. Now what? Let’s walk through it step by step.

Step 1: Create a new virtual computer

Start by clicking on the New button, and you’ll see this dialog:

Creating a virtual machine seems like the way to go, but let me mention the other two options briefly. Use default settings to create a virtual machine isn’t that useful, it creates a VPC but with minimal memory. I wouldn’t ever use this if I were you. Add an existing virtual machine on the other hand can be quite useful.

Virtual PC stores it’s data in two files, a VMC file that saves the various settings for your virtual computer, and a VHD which is your virtual hard drive. Copying these two files to another computer, launch VPC and pick this Add option, and you will open the VMC file. Away you go, you’re working in your VPC.

But let’s get back to the task at hand and create a brand new machine. Click Next to see this dialog:

It’s asking you what you wish to name your computer. You should make sure to read this carefully, if you don’t give a path then by default the vmc file will be placed in your My Documents\My Virtual Machines directory. The problem is this is your C drive, and if you are following directions you really want to run your VPCs off a different drive other than C.

I created a VPC directory on my D drive, I’d suggest you do something similar. That way you can store your VMC and VHD files in the same location. For a new machine name then, type in D:\VPC\My New Machine and click next. (By the way, in time you’ll want to use a better name, such as MyXP or MyUbuntu, but for now this will do.)

Step 2: Select your Operating System

On this screen it will ask you what operating system you’d like to install. As you can see, there’s lots of built in support for past Microsoft OS’s (and oddly OS/2). If you are installing anything else, such as a Linux distro (short for distribution), select Other, otherwise select the OS you will be installing and click Next.

On the next display you will be asked about the amount of RAM to use.

Step 3: Adjust your RAM

By default, VPC selects Using the recommended RAM, which is a measly 128 meg. Unless you are running DOS or some older OS, I would suggest bumping this up to at least 256 meg. You may want more, depending on what you’ll be doing. For doing Visual Studio development, I’d go 512 to 1024.

Click the Adjusting the Ram option and the slider bar will appear. Use it to move the RAM up or simply type a new value in the text box and click Next.

Step 4: Select or create your hard disk

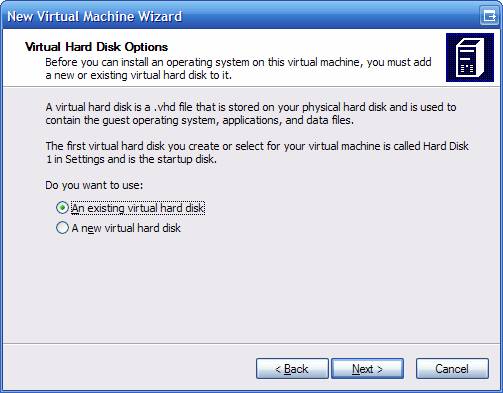
On the screen above you are asked about the Virtual Hard Disk, or your VHD file. This is another of the screens that baffles me. I wonder what bizarre logic was being used that assumed you usually had an existing VHD when you were creating a brand new virtual computer? Unless for some reason you have to rebuild the VMC file, select the A new virtual hard disk option and click next.

On this screen you are asked what you want to name the VHD file. Be default, it uses the name you gave the VMC file and adds “ Hard Disk” to it. I usually just take this default and click next.

Step 5: Confirm your choices

We’re finally at the last screen in the Wizard. Here all you have to do is confirm your choices, and click finish. So what happens next?

Well, nothing spectacular. Your Virtual PC Console will now look like this:

Now it’s time to install an operating system.

Step 6: Install an operating sytem

First, make sure your OS boot / install disk is in your CD/DVD drive. Now make sure your machine is highlighted and click Start.

A window pops up, and looks just like a computer booting up. All of a sudden you’ll see the words “Reboot and Select proper Boot device or Insert Boot Media in selected Boot device”. Now what?

Well, all it’s telling you is that it can’t find anything to boot from. By default, Virtual PC will protect you by not automatically giving access to any of the devices (hard disks or CD/DVDs) on your host system. To fix this, simply click on the CD menu, then pick Use Physical Drive E: (or what ever drive letter your CD is). Now click in the window and hit ENTER.

If all is well, your CD should start up and you will begin the process of installing whatever operating system you’ve placed in your drive. Walk through all of the steps like you normally would, formatting your hard disk, setting up partitions, etc. Don’t be worried, you won’t be hosing your real drive, but installing to your virtual drive (your VHD file).

Step 7: Configure and protect your VPC

OK, your new machine is up, now what? Well, if you are running a Windows OS I would highly suggest the very first thing you do is install AntiVirus software and a decent firewall. I know, you’re thinking “Why? My host system has these installed, won’t they protect it?” To which my answer is, NO.

You see, to the network the VPC is a real computer, with it’s own IP address and everything. It’s just as vulnerable to attacks as any other computer. If not, you couldn’t use it for a Honeypot (see my previous posting). So protect your VPC!

You’ll then want to install any system updates, to patch any security holes. It doesn’t matter if you run Linux or Windows, there’s bound to be some patches for your system out there.

Some tips for running a virtual PC

Now that you are safe and secure, you can use your OS as you would any other OS. A few tips:

  • If you want to move your mouse out of the VPC window, hit the Right ALT key. (Note the left one won’t work, has to be the right one). This will let your mouse exit the VPC window.
  • Use Right ALT + ENTER to toggle between window and full screen mode.
  • Use Right ALT + Delete in place of CTRL+ALT+DELETE for your VPC.

Finally, when you are done you have several options to exit your VPC. First, you can shut down normally from within the OS. This is the least troublesome method, but as you are doing a shut down (then later a start up) it’s more time consuming.

You can also click the Red X (cancel button) on the window, or select Action, Close on the menu. A dialog appears asking if you want to Turn Off or Save State. Save State is similar to putting your system in to hibernate mode. It writes the system state to a file with a VSV extension (and the same file name as your VMC file). Later when you restart it restores your PC just like it was.

Well, usually. I’ve found that sometimes the network doesn’t always reconnect correctly after going into Save State mode, and sometimes I’ve had issues with Linux recovering. You’ll just have to experiment to see how it works for you.

Turn off dumps the PC, sort of like yanking the plug out of the wall. For this reason I suggest you only use this when the virtual environment is totally locked up and you have no other choice.

Wrap up

Well there you go, you’ve now got a spiffy new Virtual PC you can use and abuse. In the next post we’ll talk about tweaking your Virtual PC, and the various menu options for VPC.