In the previous post of this series, Fun With KQL – DCount, we saw how to use the dcount function to get an estimated count of rows for an incoming dataset.
It’s common though to want to filter out certain rows from the count. While you could do the filtering before getting to the dcount, there’s an alternative function that allows you to do the filtering right within it: dcountif.
Note if you haven’t read the previous post on dcount, I’d advise taking a quick read now as we’ll be building on it for this post.
The samples in this post will be run inside the LogAnalytics demo site found at https://aka.ms/LADemo. This demo site has been provided by Microsoft and can be used to learn the Kusto Query Language at no cost to you.
Note that my output may not look exactly like yours when you run the sample queries for several reasons. First, Microsoft only keeps a few days of demo data, which are constantly updated, so the dates and sample data won’t match the screen shots.
Second, I’ll be using the column tool (discussed in the introductory post) to limit the output to just the columns needed to demonstrate the query. Finally, Microsoft may make changes to both the user interface and the data structures between the time I write this and when you read it.
DCountIf Basics
The dcountif function is almost identical to dcount, except it allows for an extra parameter, as you can see in this sample.
Here we are using in to see if the EventID column is in the list of values in parenthesis. We could have used any number of comparisons, for example using == to look for a single value, !in for not in, match, startswith, and many more.
In this result set, only rows whose event IDs were in the list of values are included.
DCountIf Accuracy
Just like dcount, the dcountif function returns and estimated count. You can pass in a third parameter with an accuracy level to use, these are the same as in dcount.
Accuracy Value
Error Percentage
0
1.6%
1
0.8%
2
0.4%
3
0.28%
4
0.2%
Let’s see an example of it in use.
Here we use a value of 0, which is the least accurate but fastest. As with dcount we can use values 0 to 4 to get the best balance of speed and accuracy for our needs. By default dcountif will use an accuracy level of 1 if it is omitted.
You can see the Fun With KQL – DCount post for a more extensive discussion on the topic of speed versus accuracy.
See Also
The following operators, functions, and/or plugins were used or mentioned in this article’s demos. You can learn more about them in some of my previous posts, linked below.
In this post we saw how dcountif can be used to get an estimated distinct count, but also allow you to filter out certain rows from the count, all with a single function.
If you don’t have a Pluralsight subscription, just go to my list of courses on Pluralsight . At the top is a Try For Free button you can use to get a free 10 day subscription to Pluralsight, with which you can watch my courses, or any other course on the site.
In an earlier post in this series, Fun With KQL – Count, you saw how to use the count operator to count the number of rows in a dataset.
Then we learned about another operator, distinct, in the post Fun With KQL – Distinct. This showed how to get a list of distinct values from a table.
While we could combine these, it would be logical to have a single command that returns a distinct count in one operation. As you may have guessed by the title of this post, such an operator exists: dcount.
The samples in this post will be run inside the LogAnalytics demo site found at https://aka.ms/LADemo. This demo site has been provided by Microsoft and can be used to learn the Kusto Query Language at no cost to you.
Note that my output may not look exactly like yours when you run the sample queries for several reasons. First, Microsoft only keeps a few days of demo data, which are constantly updated, so the dates and sample data won’t match the screen shots.
Second, I’ll be using the column tool (discussed in the introductory post) to limit the output to just the columns needed to demonstrate the query. Finally, Microsoft may make changes to both the user interface and the data structures between the time I write this and when you read it.
SecurityEvent
Before we begin, let me mention for this post we’ll move away from the Perf table and use a new one, SecurityEvent. This table is just what it sounds like. Every time an object in your Azure instance, such as a server, has a security related event it gets logged to this table.
The SecurityEvent table has data a bit better suited for demonstrating the dcount function. Plus by this point, assuming you’ve been following along in the Fun With KQL series, you’re probably tired of looking at the Perf table.
A Refresher on Distinct
As dcount is a combination of distinct and count, let’s take a moment to refresh ourselves on them. We’ll start with the distinct operator.
Distinct returns a single entry for the columns indicated, no matter how many times they occur in the dataset. Here’s a simple example, where we want a list of distinct values for the combination of the EventID and Activity columns.
Taking a look at the first row, we have the event ID of 4688 and activity value of "4688 – A new process has been created.". This combination of values could occur once, or one million times in the SecurityEvent table. No matter how many times this combination appears, it will only show up once in the dataset produced by distinct.
Combining Distinct with Count
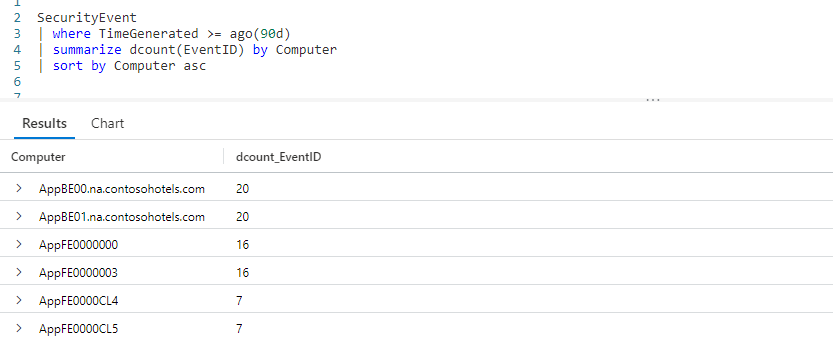
In the opening I mentioned we can combine distinct with count to get a distinct count. In the example below, we’ll pipe our SecurityEvent table into a where to limit the data to the last 90 days.
Be aware this query is a little different from the previous one. Here we are getting a distinct set for the combination of the computer name and the event ID. In this result set a computer will have multiple events associated with it. Here is some example data that might output from the distinct, to illustrate the point.
Computer Name
EventID
WEB001
4668
WEB001
5493
WEB001
8042
WEB001
5309
SQL202
0867
SQL202
5309
The result of our distinct is piped into the summarize operator. In the summarize we’re using the count to add up the number of EventID entries for each computer.
Finally we use a sort to list our computer names in ascending alphabetical order.
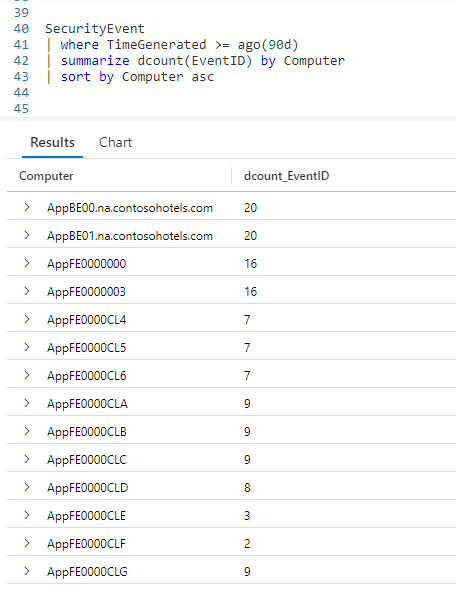
Our first entry, AppBE00.na.contosohotels.com, had 20 events associated with it. The last entry, AppFE0000CLG, only had 9 security related events.
DCount Basics
While we got our results, it was quite a bit of extra work. We can make our code much more readable by using dcount.
In the example below, we’ll replace the two lines of code containing distinct and count, and condense it into a single line.
Here we use a summarize, followed by our dcount function. Into dcount we pass a parameter of the column name we want to count, in this case the EventID. We follow that with by Computer to indicate we want to sum up the number of distinct events for each computer name.
Speed Versus Accuracy (Don’t Skip This Part!!!)
There’s one important thing you have to know, and that is the count function can be slow. It has to go over every row in the incoming dataset to get the count, in a big dataset that can take a while.
The dcount function is much faster because it uses an estimated count. It may not be perfectly accurate, but will execute much faster.
Whether to use it is dependant on your goal. If you are trying to uncover computers with large numbers of events, it may not matter if AppBE00.na.contosohotels.com had 20 events, 19, or 21, you just need to know it had a lot (especially compared to other servers) so you can look at them.
On the other hand if you are dealing with, for example, financial data, you may need a very accurate value and hence avoid dcount in favor of the distinct + count combination.
Adjusting the Accuracy Level
The dcount function supports a second parameter, accuracy. This is a value in the range of 0 to 4. Below is a table which represents the error percentage allowed for each value passed in the accuracy parameter.
Accuracy Value
Error Percentage
0
1.6%
1
0.8%
2
0.4%
3
0.28%
4
0.2%
An accuracy level of 0 will be the fastest, but the least accurate. Similarly, a value of 4 will be the slowest, but most accurate.
When the accuracy parameter is omitted, the default value of 1 is used.
Using the Accuracy Parameter
Here is an example of using the accuracy parameter. We’ll set it to the least accurate, but fastest level of 0.
As you can see, within the dcount after the EventID parameter we have a second parameter. We pass in a 0, indicating we want the fastest run time and will settle for a lesser accuracy.
Here is an example where we want a little better accuracy than the default of 1, and are willing to accept a longer query execution time.
As you can see, we are passing in a value of 2 for the accuracy parameter.
What Accuracy Value to Use?
So which value should you pick? As stated earlier, that’s dependant on your dataset and the goal of your query. If you are just taking a quick look and are OK with a rough estimate, you can use a lower value. Alternatively you can bump it to a larger value if you aren’t satisfied.
The best thing you can do is experiment. Run the query using each of the five values (0 to 4) and look at the results, deciding which best suits your needs for your particular goal.
See Also
The following operators, functions, and/or plugins were used or mentioned in this article’s demos. You can learn more about them in some of my previous posts, linked below.
In this post we learned how the dcount function can return a value faster than the combination of distinct plus count, although it may not be as accurate.
We then saw how we could adjust the accuracy level used in the dcount function, and got some advice on how to choose a level that balanced your need for speed with accuracy.
If you don’t have a Pluralsight subscription, just go to my list of courses on Pluralsight . At the top is a Try For Free button you can use to get a free 10 day subscription to Pluralsight, with which you can watch my courses, or any other course on the site.
Often we want to get data that is relative to other data. For example, we want a list of computers that have free space that is greater than the free space of other computers. We need to set a threshold, for example we want to return results where the free space is greater than 95% of the free space on other computers.
To do this, Kusto provides the percentile operator, along with its variants percentiles and percentiles_array.
One hundred percent of the samples in this post will be run inside the LogAnalytics demo site found at https://aka.ms/LADemo. This demo site has been provided by Microsoft and can be used to learn the Kusto Query Language at no cost to you.
Note that my output may not look exactly like yours when you run the sample queries for several reasons. First, Microsoft only keeps a few days of demo data, which are constantly updated, so the dates and sample data won’t match the screen shots.
Second, I’ll be using the column tool (discussed in the introductory post) to limit the output to just the columns needed to demonstrate the query. Finally, Microsoft may make changes to both the user interface and the data structures between the time I write this and when you read it.
Percentile Basics
In this first example, we’ll use the percentile function to return a list of computers who have more than (or equal to) 90% of the free space of the other computers in the Perf table.
We take the Perf table and pipe it through a where to restrict the results to the Available MBytes counters.
This is piped into a summarize, where we employ the percentile function. In the first parameter we pass the column with the value to analyze, in this case it is the CounterValue column. In the second parameter, we pass in the threshold value, in this case 90.
Finally we use the by clause of summarize to indicate how we want to summarize the results. Here, we want to summarize by the ComputerName column.
In the results, we see a list of computers from the Perf table whose Available MBytes values are greater than or equal 90 percent of the other computers in the Perf table.
Do note, the Perf table actually represents a table of performance counter entries, so strictly speaking this isn’t totally accurate data. However we’ve been using the Perf table throughout this Fun With KQL series, so it will do for this example.
Percentiles Basics
The percentile function works fine for a single percentage, but what if you wanted to find values across a range of percentages? For example, you want to return values for 5, 50, and 95 percent?
Rather than having to run three different queries, Kusto provides a percentiles function so you can return multiple values at once.
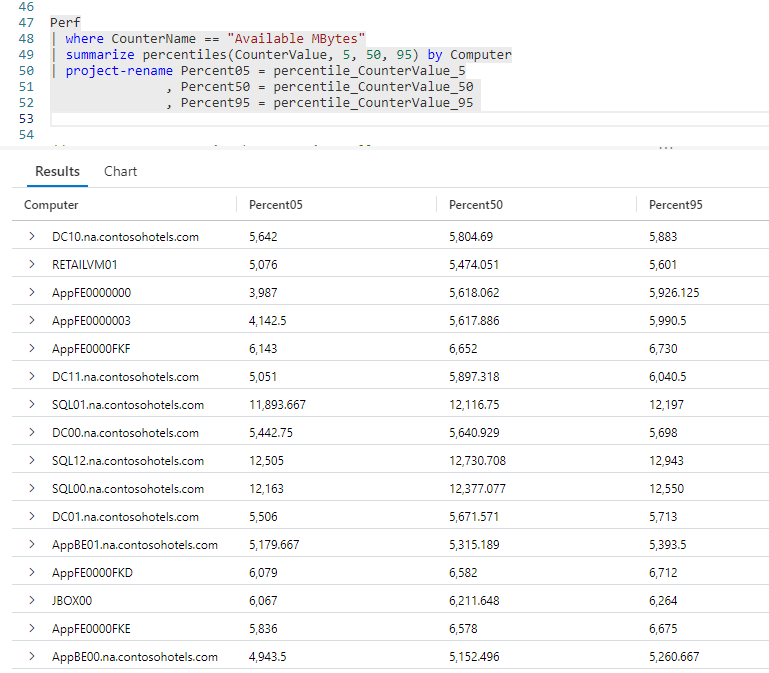
The query is almost identical to the previous one, except we are using percentiles instead. As before the first parameter is the column to analyze. Next, we have multiple values to use for our percentile calculations.
Here we used three, 5, 50, and 95, however we could use just two, or more than just three.
At the end a sort by was used to order the output by the name of the computer.
In the output you see three columns for each computer, reflecting the Available MBytes values for 5, 50, and 90 percent.
Renaming The Output Columns
In the previous example the default column names that the percentile function output were rather, well ugly to put it bluntly. We could improve on it by using an operator we’ve seen before, project-rename.
Our query is identical to the previous, except the sort by was replaced with project-rename. (The sort could have been retained, I simply removed it to make the example a bit simpler.)
If you recall my post Fun With KQL – Variants of Project, all we have to do is list each new column name we want to use, then after the equal sign the existing column to assign to it.
Our new names are a lot better, but we can streamline the rename process even more. The summarize operator allows us to rename when we make the call.
After the summarize operator we list each new column name we want to use for the output in parenthesis. As you can see, the output used the new column names we provided.
Multiple Levels of Percentiles
In the previous example, we used three percentiles, however this is no limit. In this next example we’ll bump it up to five.
Here we used the same technique as the previous sample, except we have more percentile values. As you can see, we also took advantage of KQL’s flexible layout to make the query easier to read.
Percentiles As An Array
There may be times when we want the percentiles returned in an array instead of columns. For that there’s an alternate version of the percentiles function, percentiles_array.
The first parameter passed into the percentiles_array function is the column we’re evaluating, here CounterValue. The remaining parameters are the percentile values to use. Here we used our original three, but we could have used as many as we needed.
We could call on our old friend mv-expand (covred in the post Fun With KQL – MV-Expand) to turn the expand the array into rows.
See Also
The following operators, functions, and/or plugins were used or mentioned in this article’s demos. You can learn more about them in some of my previous posts, linked below.
If you don’t have a Pluralsight subscription, just go to my list of courses on Pluralsight . At the top is a Try For Free button you can use to get a free 10 day subscription to Pluralsight, with which you can watch my courses, or any other course on the site.
When I haven’t used Azure from PowerShell in some time, I’ll get an error “failed to acquire token” when using cmdlets such as Get-AzSubscription or Get-AzContext.
To add to the confusion, sometimes Connect-AzAccount appears to work and log me in, but I’ll still get the error.
Under the hood, the Azure cmdlets are caching some connection tokens. Fixing this issue is pretty simple, although not intuitive or easy to find the solution. All you have to do is issue the following cmdlet:
Clear-AzContext
This will remove old tokens from your system.
After issuing the clear command, just end your current PowerShell session, then login again using Connect-AzAccount and you should be good to go.
My latest course, Introduction to the Azure Data Migration Service, has just gone live on Pluralsight.
More and more companies are migrating their infrastructure, including their databases, to Azure. In this course, Introduction to the Azure Data Migration Service, you will learn foundational knowledge of Microsoft’s migration service.
First, you will learn how to use the Azure Data Migration Assistant to analyze your existing database for any compatibility issues with the Azure SQL platform.
Next, you will discover how to use the same tool to generate and deploy your database schema to an Azure SQL Database. Finally, you will explore how to migrate your data using the Data Migration Service.
When you are finished with this course, you will have the basic skills and knowledge of the Azure Data Migration Service needed to begin moving your databases into Azure.
Even better, this course is totally free! You will need an account at Pluralsight, but those are free to setup and only takes a moment. You do not have to have a paid plan. Once you have your account you can begin watching.
What? You haven’t heard of Kusto or KQL?
Increasingly, Azure is becoming the infrastructure backbone for many corporations. It is imperative then, that you have the ability to query Azure to gain insights to the Azure services your company is using. The Kusto Query Language, or KQL for short, is the language you use to query these Azure services such as Azure Log Analytics, Azure Security Center, Azure Application Insights, and Windows Defender Advanced Threat Protection.
Kusto is the new database engine that stores data for all of these services. Kusto was designed from scratch to be a “big data” repository for Azure that was easy to query using KQL.
The course starts with the basics of KQL, the Kusto Query Language. In the first module alone you’ll learn 80% of the commands to cover most of the queries you’ll need.
Most, but not all, as KQL has many more commands to handle unique needs. After learning a variety of aggregation operators, you will progress to advanced KQL abilities such as machine learning and time series analysis.
Finally, you will explore how to export the results of your KQL queries to CSV files and PowerBI. When you’re finished with this course, you will have the skills and knowledge of the Kusto Query Language needed to gain valuable insights to your Azure services.
My latest course is now available on Pluralsight! It’s the Azure PowerShell Playbook: Azure SQL. If you aren’t familiar with Pluralsight’s Playbook format, they are fast past courses that are almost 100% demo driven. They are meant to be consumed quickly, my course is just one hour and four minutes long. Great lunchtime viewing!
This course shows you how to use PowerShell to manage and migrate your on premises database up to Azure SQL. In brief, you’ll learn how to:
Create resource groups
Create and work with Storage Accounts
Create a SQL Server in Azure SQL
Package up your local database into a bacpac file
Import your bacpac file into a new Azure SQL database
Execute commands against your new Azure SQL database
Cleanup! I even show how to remove everything you’ve created, individually or as a whole
And all of this with PowerShell!
Additionally, I’ve included functions for just about everything listed, so (assuming your subscription gives you access to the samples) you’ll have a great starting point for your own library of cmdlets. (All the code for the functions appears on screen, so if you have to you could always pause and type it in.)
I also wrote an article for RedGate’s SimpleTalk website that aligns well with this course. I dive deeper into the restartability aspect of the way the functions were coded, something I couldn’t get deep into with the video course due to time constraints.
What’s that? Yes you in the back row, you say you don’t have a Pluralsight subscription? Well no worries, just email me, free@arcanetc.com and I’ll be glad to send you a code that will be good for 30 days at Pluralsight. During that time you can watch my courses, indeed you can watch any course at Pluralsight.
A few posts back I mentioned that I had become a SimpleTalk author, and that my first post for them was PowerShell Functions For Reusability and Restartability in Azure (read it at http://bit.ly/acred01)
I’ve created a companion video for it, which focuses on creating Resource Groups. You can see it below, or on YouTube at http://bit.ly/acredyt01.
As I mention in the video, you can find the code samples on my github site, at http://bit.ly/acredgit01
Adding to my other activities, I’m now writing for SimpleTalk, RedGate’s community hub. My first article just went live.
PowerShell Functions for Reusability and Restartability in Azure is the title, in it I describe how to implement the concepts of reusability and restartability in PowerShell. The functions were written against the Azure platform, however the concepts are valid for any PowerShell implementation. You can read the full article at:
I’ve been working a lot in the Azure PowerShell area of late. One thing I wanted to be able to do is have my scripts login automatically to Azure. In many examples the cmdlet Save-AzureRmProfile was used to save your Azure credentials, then later you could use Import-AzureRmProfile to import them.
But, when I attempted to run Save-AzureRmProfile I got the error ‘Save-AzureRmProfile is not recognized as the name of a cmdlet, function, script file, or operable program’. Huh? I checked the docs, and it does include a listing for Save-AzureRmProfile.
This is a case of the PowerShell AzureRM module getting ahead of the docs. After beating my head against the wall, I found the cmdlets had been replaced with the new noun of AzureRmContext.
To use them, first login to Azure manually. Then, use the new Save-AzureRmContext to save your information to a file.
# Setup – First login manually per previous section Add-AzureRmAccount
# Now save your context locally (Force will overwrite if there) $path="C:\Azure\PS\ProfileContext.ctx’ Save-AzureRmContext-Path$path-Force
Once that’s done, from then on you can use the Import-AzureRmContext to automate the login.
# Once the above two steps are done, you can simply import $path= ‘C:\Azure\PS\ProfileContext.ctx’ Import-AzureRmContext-Path$path
Be warned, this does present a security issue. If someone were to steal your context file, they could then login as you. You need to be sure your context file is stored in a safe location no one can get to.
If you are like me, you missed PDC this year, and are probably pretty bummed about it. Fortunately you do get second chances sometimes! Microsoft is hosting a series of developer conferences around the country called the MSDN Developer Conference. This is a one day event that highlights the best of the PDC presentations, put on by a mix of Microsoft employees and community leaders in the area where the conference is held. I’ll be attending the Atlanta event on December 16 2008, but there are events in Houston, Orlando, Chicago, and other areas beginning in December and running into February of next year. Be sure to check the site for more info.
There will be three tracks at the event, the new Azure Services Platform, Client and Presentation, and Tools Languages and Frameworks. There is a $99 attendance fee, but if you compare that to the cost of PDC that’s quite a bargain. There’s also going to be some cool swag, and attendance is limited so be sure to register today.