Introduction
This post begins a new series on KQL – The Kusto Query Language. KQL is used to query large datasets on the Azure platform. In this new series you’ll learn many aspects of the Kusto language. There are a variety of places KQL is used on the Azure platform, including Azure Log Analytics, Azure Application Insights, Windows Defender Advanced Threat Protection, and the Azure Security Center to name a few.
Best of all, you can experiment with KQL without the need for your own dedicated Azure account. Microsoft has provided a user interface and sample dataset at https://aka.ms/LADemo you can use to learn Kusto at no cost to you.
In this introductory post, we’ll explore the user interface and write our first, very simple, KQL query. You might want to bookmark this post so you can easily refer back to it.
The Log Analytics User Interface
As mentioned, there are many places in Azure where you can use the KQL language to perform data analysis. For this series of blog posts, we will use the Azure Log Analytics demo site provided by Microsoft.

Across the top is the standard Azure toolbar. In the upper left is the Home > navigator, and under it is the Logs logo letting you know where you are. As these are standard Azure interface elements we won’t dig deeper into them.
The Query Area
The main portion of the interface is taken up by the query area.

The area in the upper half is where you enter the query you want to run. The lower half is where the results are displayed. We’ll see an example of this in action later in this post.
Just above the query area is a toolbar. The Run button will execute the query you’ve entered. Note too, you can use the keyboard command SHIFT+ENTER to run a query. I’m a keyboard guy, so this is what I use most often to run queries, which you’ll see if you take either of my KQL courses on Pluralsight (I’ve linked to them in the Conclusion of this post).
To the right of the Run button is a Time range. You can use this to limit the time range for your query. We’ll learn more about this in a future post.
The Save button is pretty obvious, it will allow you to save your query. Share will let you share your query, or the results of the query.
New alert rule will let you add alerts for your queries. Export will let you export the results of your query to a CSV file or other formats.
Pin to lets you pin the query to your Azure dashboard, useful for frequently run queries.
The final menu option, Format query, does just that. Reformats you query to make it look nice and more readable.
Be aware, within the demo environment some of these features will be disabled. For example, you cannot save you query to the demo environment. In your own Azure environment however these will work fine.
The Side Bar
Over on the left you’ll see the side bar area. This holds a lot of items, so let’s take a look.

At the very top you see a tab shape holding the text New Query 1. It is possible to create multiple tabs, each with its own query and result pane. You can use the + (Plus button) beside the tab to open a new tab, and the x just within the tab to close it.
Under the tab is the word Demo. This is the name of the dataset you are working with. This would be similar to a database name in SQL Server, although be aware this is most definitely not a relational database.
Next up you see Tables, Queries, and Functions. These control what is displayed in the lower side bar area. Right now it is set to Tables, which we’ll dive into in just a moment.
Below this is a search bar, which you can use to search for a table name, or a query or function when that data is displayed. Under the search bar is a filter button, as well as ways you can group the information. We’ll go over these more in a future post.
Below this is the Favorites. If you have tables that you reference frequently, you can add them to the favorites for quick reference.
The Side Bar – Tables
Under the favorites are your tables, with the tables grouped into solutions. Let’s expand the LogManagement solution by clicking the triangle beside it.

What you can see is a partial list of tables in the Log Management solution, there are too many to fit in a single screen capture. If you scroll down you’ll see there are a lot of tables!
Scroll down to find the Perf table. We will be using this table a lot in this Fun With KQL blog series.

If you hover over the table name (and you don’t have to expand the table for this to work) a popup will appear. It has the name of the table, and a description of the data in it. Notice the star to the right of the table name. If you hover over it, a helpful hint Add to favorites appears. You can just click on the start to add it to your favorites area.
Under the table name you’ll see Use in editor. Clicking on it will insert the table name into your query window. For the Perf table this isn’t a big deal, but there are some long winded table names such as ContainerRegistryRepositoryEvents. Being able to click and insert will make authoring a query go a bit faster as well as reduce issues from typing mistakes.
At the bottom of this informational pop out is a section Useful links. Clicking on the link will open a new page to the Microsoft documentation for this table.
With the table expanded, you can now see all of the columns in this table. To the right of the column name is its data type. These are pretty standard data types, string, int, real (also known as a float, double, etc. in other languages), datetime, and more.
If you double click on the column name, it will insert the name of the column into the query editor.
The Side Bar – Queries
Let’s change the contents of the side bar by clicking on the Queries at the top of the side bar. Here you will see queries which Microsoft has built for you. You can use these as examples for building your own queries.

The queries are grouped into categories, although you can use the Group by to change this to a variety of other groupings.
Go down and expand the Other grouping, then scroll down a bit. Look for the queries that begin with m1_.

These are the queries I used in my Kusto Query Language (KQL) from Scratch course. Microsoft sponsored this course, and wanted to include them on the demo site. The m followed by a number indicates which module in the course the demos are associated with. The majority of the samples I will be using in this Fun With KQL series of blog posts will be derived from the m1-demo-intro and m2-demo-80-percent queries.
If you hover over the query name a pop out appears. It has a brief description, and the ability to either Run the query, or Load to editor. Unless it is a query you authored and run frequently, I suggest always loading it into the editor to review first.
The Side Bar – Functions
Let’s now click on the Functions at the top of the side bar.

This is a list of built in functions you can use in your queries. We won’t be going into functions as part of this Fun With KQL introductory series, but know this is where you can find them.
Additional Tools
As the final step in this introduction, lets look at the small toolbar just above the query editor, to the very right side of the user interface.

The Feedback is pretty obvious. A pop out will appear from the right side where you can file issues, ask for help, give product suggestions, or just tell the team at Microsoft how much you love KQL and the user interface.
The Queries button causes a window to appear, which displayes all of the built in queries in a card format. You can scroll down with all of the queries loaded, or click on one of the categories on the left to narrow the view.

If you hover over one of the query boxes it will provide the option to run the query or load the query into the editor. This is an easy way to browse through all of the queries and get more information about them.
The very right most item in this toolbar is a drop down menu with several options.
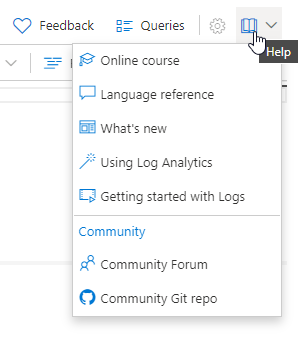
At the bottom are links to the Community pages where you can find help at the forums or jump to the GitHub repo for the Azure Monitor Community.
Just above it are four links to Microsoft documentation pages around the user interface as well as the Kusto Query Language.
The very top most item is a link to an Online course you can take. This will take you to Pluralsight and specifically the Kusto Query Language (KQL) from Scratch course.

And look at that, the author is little old me! Yes, this is the course I created for Pluralsight, sponsored by Microsoft. If you have a Pluralsight subscription already you can just sign in and take the course. If not, you can go to this link Kusto Query Language (KQL) from Scratch and use the Try for free link. You’ll get a free 10 day pass to Pluralsight with which you can watch my KQL courses, or any of the courses on Pluralsight including the many courses I have done for Pluralsight over the years.
Your First Query
Whew, that was a lot of info, but now you have a good understanding of the user interface. In this case it is for examining Log Analytics, but the UI is similar for most of the places you can use Kusto with.
It’s time to write our first Kusto query. Remember the Perf table we looked at earlier? Lets write a query to return the contents of the Perf table.
In the query editor, type in Perf. Note that when it comes to table and column names KQL is case senstive. Perf is not the same as perf or PERF. The latter two will cause an error if you attempt to use them.
That’s it, no having to use a Select, no requirement to enter column names, just enter the name of the table, then click the Run button, or use SHIFT+ENTER.

To prevent a run away query, the interface limits the maximum number of rows that are returned, here 30,000. This is shown to you in the blue informational box just above the query resutls. You can dismiss the message by clicking the x toward the right side.
At the bottom it shows the run time for the query, here just a little over three seconds. That’s one of the huge benefits to Kusto, it is very fast!
If you click on any column header it will provide a few options.
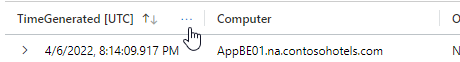
The up and down arrows can be used to change the sorting between ascending and descending order. Faintly visible are the three dots which brings up a menu. In this menu you can filter the results.
If you look to the right side you’ll see the word Columns displayed vertically. Clicking it causes the column filter tool to pop out.

You can use this to unselect (or reselect) columns from the output. You can also transform the output to a pivot table. Note the pivot table is a new feature since the KQL from Scratch course was created.
The last thing to note is the Query details link on the very bottom right. This causes a pop out with more information about the execution of the query.

This gives a brief overview that can assist you with query tuning. I won’t take the time to go over each statistic, you can use the little i in a circle button to the right of each one for more details.
A Note on Result Filtering
Before I leave, I just wanted to point out an important aspect of filtering the results. These filters apply after the query has been run. Kusto has already brought back the (in this case) 30,000 rows of data.
There are techniques you can use when writing your queries that will filter down the results before they are returned. This will make the queries run faster, and make it easier to work with the data. Stay tuned, as we’ll be learning many of these techniques in this blog series, Fun With KQL.
Conclusion
Congratulations, and a big thank you for reading this far. It was a long blog post, but there were a lot of aspects of the user interface to cover.
You may want to bookmark this post for future reference. From here on we’ll be focused on the Kusto language itself, and only mention elements of the user interface when needed.
The demos in this series of blog posts were inspired by my Pluralsight courses Kusto Query Language (KQL) from Scratch and Introduction to the Azure Data Migration Service, two of the many courses I have on Pluralsight. All of my courses are linked on my About Me page.
If you don’t have a Pluralsight subscription, just go to my list of courses on Pluralsight . At the top is a Try For Free button you can use to get a free 10 day subscription to Pluralsight, with which you can watch my courses, or any other course on the site.
