Introduction
In the conclusion of my last post, Fun With KQL – Datatable, I mentioned a datatable can also be useful when you need to do special calculations. I decided it really needed further explanation and created this post to dive in a bit deeper.
If you haven’t read my datatable post yet, you should as I’ll refer back to it. Go ahead, I’ll wait.
The samples in this post will be run inside the LogAnalytics demo site found at https://aka.ms/LADemo. This demo site has been provided by Microsoft and can be used to learn the Kusto Query Language at no cost to you.
If you’ve not read my introductory post in this series, I’d advise you to do so now. It describes the user interface in detail. You’ll find it at https://arcanecode.com/2022/04/11/fun-with-kql-the-kusto-query-language/.
Note that my output may not look exactly like yours when you run the sample queries for several reasons. First, Microsoft only keeps a few days of demo data, which are constantly updated, so the dates and sample data won’t match the screen shots.
Second, I’ll be using the column tool (discussed in the introductory post) to limit the output to just the columns needed to demonstrate the query. Finally, Microsoft may make changes to both the user interface and the data structures between the time I write this and when you read it.
Datatable and Calculations
For this example we’ll revisit the Perf table. The Perf table has two main columns that we’ll use in this example, CounterName and CounterValue.
Our goal for this query is to multiply the CounterValue by some number, based on the CounterName. We could of course use a case or iif within the query, but that would result in a query that is long and hard to read and later modify if we need to.
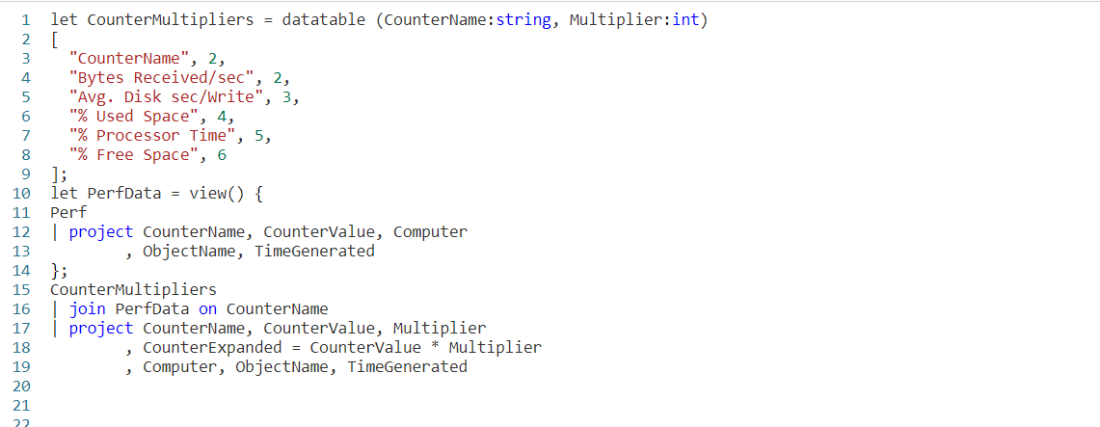
Using a datatable will result in a query that is much more readable and maintainable. As the actual code for the query is a bit long I’ll place it below to make it easy to follow along. Note I’ll only skim over things we covered in the previous post, refer to it for more detailed explanations.
let CounterMultipliers = datatable (CounterName:string, Multiplier:int)
[
  "CounterName", 2,
  "restartTimeEpoch", 3,
  "memoryWorkingSetBytes", 4,
  "memoryRssBytes", 5,
  "memoryRequestBytes", 2,
  "memoryLimitBytes", 3,
  "memoryCapacityBytes", 4,
  "memoryAllocatableBytes", 5,
  "cpuUsageNanoCores", 2,
  "cpuRequestNanoCores", 3,
  "cpuLimitNanoCores", 4,
  "cpuCapacityNanoCores", 5,
  "cpuAllocatableNanoCores", 2,
  "Total Bytes Transmitted", 3,
  "Total Bytes Received", 4,
  "Logical Disk Bytes/sec", 5,
  "Free Megabytes", 2,
  "Disk Writes/sec", 3,
  "Disk Write Bytes/sec", 4,
  "Disk Transfers/sec", 5,
  "Disk Reads/sec", 2,
  "Disk Read Bytes/sec", 3,
  "Disk Bytes/sec", 4,
  "Bytes Sent/sec", 5,
  "Bytes Received/sec", 2,
  "Avg. Disk sec/Write", 3,
  "Avg. Disk sec/Transfer", 4,
  "Avg. Disk sec/Read", 5,
  "Available MBytes Memory", 2,
  "Available MBytes", 3,
  "% Used Space", 4,
  "% Processor Time", 5,
  "% Free Space", 6
];
let PerfData = view() {
Perf
| project CounterName
        , CounterValue
        , Computer
        , ObjectName
        , TimeGenerated
};
PerfData
| join CounterMultipliers on CounterName
| project CounterName
        , CounterValue
        , Multiplier
        , CounterExpanded = CounterValue * Multiplier
        , Computer
        , ObjectName
        , TimeGenerated
We begin with a let, where we will create a new datatable. I chose to name it CounterMultipliers, but we could have used any name we wanted.
The datatable will have two columns, the CounterName which is a string, and the Multiplier which I made an int.
I used a simple query to get the list of CounterName values:
Perf
| distinct CounterName
| sort by CounterName
I then copied the output into my query editor. I wrapped the names in quotes so they would be interpreted as strings. Next I have a comma, then the integer value to use for the multiplier.
Note I just picked a few random values to use here. In a real world situation this kind of operation, multiplying counter values, might not make much sense, but it will serve OK for this example.
After finishing the datatable definition I use a second let to create a temporary view on top of the Perf table and named the view PerfData. For more on this technique refer back to the Fun With KQL – Datatable post.
Now we take our PerfData view and join it to our datatable, CounterMultipliers. Note that I used the best practice of naming the counter name column in the datatable the same as in the PerfData view. It makes the query easier to read, and avoids the need for $left and $right as I described in the previous post.
Finally we pipe the output of the join into a project operator. I return all the columns, but add a new one, CounterExpanded. For its calculation I simply take the CounterValue column from the PerfData view and multiply it by the Multiplier column from the `datatable.
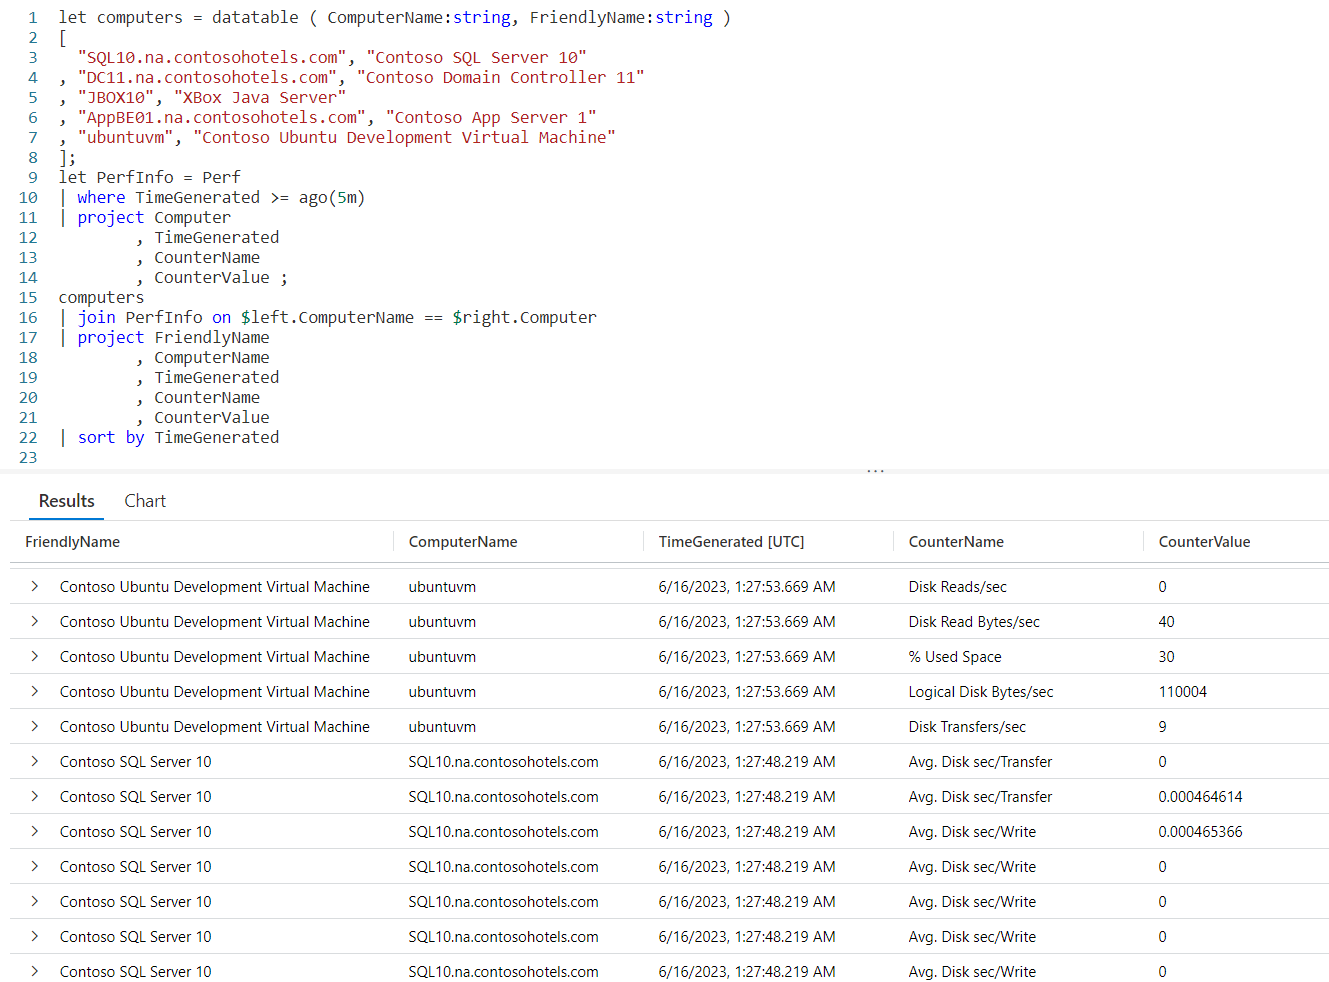
Below you can see the output from the query.
In the lower right, as well as in the blue area at the top of the output, you can see over 300,000 rows were returned. This is the output we expect, every row in the Perf table (from the view) linked to each row in the CounterMultipliers datatable.
Including and Excluding Columns
In this example, in the output I included the Multiplier column. This was done so you could see the data and test the calculation for yourself. In a normal situation you likely wouldn’t be doing this.
I also included the CounterValue column. Again, this may or may not be needed, you could choose to have just the CounterExpanded column.
Think about the output, and how it will be used to decide if you want to include these types of columns in your query output.
See Also
The following operators, functions, and/or plugins were used or mentioned in this article’s demos. You can learn more about them in some of my previous posts, linked below.
Fun With KQL – Case
Fun With KQL – Datatable
Fun With KQL – IIF
Fun With KQL – Join
Fun With KQL – Let
Fun With KQL – Project
Fun With KQL – Summarize
Conclusion
In this post we learned how to use a datatable to create calculated values. This made the code much cleaner, and easier to read.
The demos in this series of blog posts were inspired by my Pluralsight courses on the Kusto Query Language, part of their Kusto Learning Path.
There are three courses in this series so far:
I have two previous Kusto courses on Pluralsight as well. They are older courses but still valid.
These are a few of the many courses I have on Pluralsight. All of my courses are linked on my About Me page.
If you don’t have a Pluralsight subscription, just go to my list of courses on Pluralsight. On the page is a Try For Free button you can use to get a free 10 day subscription to Pluralsight, with which you can watch my courses, or any other course on the site.