Fun With KQL – Percentiles

Introduction

Often we want to get data that is relative to other data. For example, we want a list of computers that have free space that is greater than the free space of other computers. We need to set a threshold, for example we want to return results where the free space is greater than 95% of the free space on other computers.

To do this, Kusto provides the percentile operator, along with its variants percentiles and percentiles_array.

One hundred percent of the samples in this post will be run inside the LogAnalytics demo site found at https://aka.ms/LADemo. This demo site has been provided by Microsoft and can be used to learn the Kusto Query Language at no cost to you.

If you’ve not read my introductory post in this series, I’d advise you to do so now. It describes the user interface in detail. You’ll find it at https://arcanecode.com/2022/04/11/fun-with-kql-the-kusto-query-language/.

Note that my output may not look exactly like yours when you run the sample queries for several reasons. First, Microsoft only keeps a few days of demo data, which are constantly updated, so the dates and sample data won’t match the screen shots.

Second, I’ll be using the column tool (discussed in the introductory post) to limit the output to just the columns needed to demonstrate the query. Finally, Microsoft may make changes to both the user interface and the data structures between the time I write this and when you read it.

Percentile Basics

In this first example, we’ll use the percentile function to return a list of computers who have more than (or equal to) 90% of the free space of the other computers in the Perf table.

We take the Perf table and pipe it through a where to restrict the results to the Available MBytes counters.

This is piped into a summarize, where we employ the percentile function. In the first parameter we pass the column with the value to analyze, in this case it is the CounterValue column. In the second parameter, we pass in the threshold value, in this case 90.

Finally we use the by clause of summarize to indicate how we want to summarize the results. Here, we want to summarize by the ComputerName column.

In the results, we see a list of computers from the Perf table whose Available MBytes values are greater than or equal 90 percent of the other computers in the Perf table.

Do note, the Perf table actually represents a table of performance counter entries, so strictly speaking this isn’t totally accurate data. However we’ve been using the Perf table throughout this Fun With KQL series, so it will do for this example.

Percentiles Basics

The percentile function works fine for a single percentage, but what if you wanted to find values across a range of percentages? For example, you want to return values for 5, 50, and 95 percent?

Rather than having to run three different queries, Kusto provides a percentiles function so you can return multiple values at once.

The query is almost identical to the previous one, except we are using percentiles instead. As before the first parameter is the column to analyze. Next, we have multiple values to use for our percentile calculations.

Here we used three, 5, 50, and 95, however we could use just two, or more than just three.

At the end a sort by was used to order the output by the name of the computer.

In the output you see three columns for each computer, reflecting the Available MBytes values for 5, 50, and 90 percent.

Renaming The Output Columns

In the previous example the default column names that the percentile function output were rather, well ugly to put it bluntly. We could improve on it by using an operator we’ve seen before, project-rename.

Our query is identical to the previous, except the sort by was replaced with project-rename. (The sort could have been retained, I simply removed it to make the example a bit simpler.)

If you recall my post Fun With KQL – Variants of Project, all we have to do is list each new column name we want to use, then after the equal sign the existing column to assign to it.

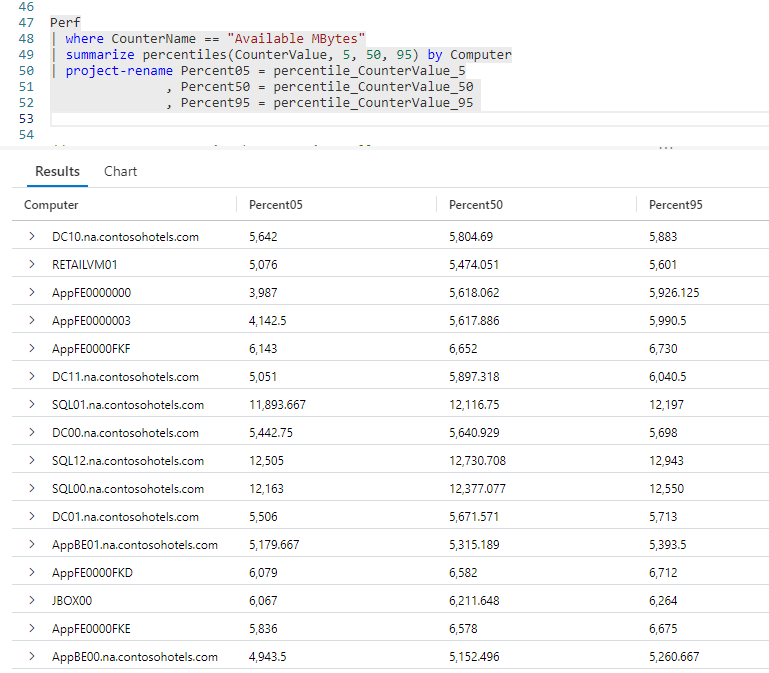
Our new names are a lot better, but we can streamline the rename process even more. The summarize operator allows us to rename when we make the call.

After the summarize operator we list each new column name we want to use for the output in parenthesis. As you can see, the output used the new column names we provided.

Multiple Levels of Percentiles

In the previous example, we used three percentiles, however this is no limit. In this next example we’ll bump it up to five.

Here we used the same technique as the previous sample, except we have more percentile values. As you can see, we also took advantage of KQL’s flexible layout to make the query easier to read.

Percentiles As An Array

There may be times when we want the percentiles returned in an array instead of columns. For that there’s an alternate version of the percentiles function, percentiles_array.

The first parameter passed into the percentiles_array function is the column we’re evaluating, here CounterValue. The remaining parameters are the percentile values to use. Here we used our original three, but we could have used as many as we needed.

We could call on our old friend mv-expand (covred in the post Fun With KQL – MV-Expand) to turn the expand the array into rows.

See Also

The following operators, functions, and/or plugins were used or mentioned in this article’s demos. You can learn more about them in some of my previous posts, linked below.

Fun With KQL – MV-Expand

Fun With KQL – Project

Fun With KQL – Sort

Fun With KQL – Summarize

Fun With KQL – Variants of Project

Fun With KQL – Where

Conclusion

In this post we saw how to use percentiles to evaluate data in relation to other data. We also saw how to return this data in array form.

The demos in this series of blog posts were inspired by my Pluralsight courses Kusto Query Language (KQL) from Scratch and Introduction to the Azure Data Migration Service, two of the many courses I have on Pluralsight. All of my courses are linked on my About Me page.

If you don’t have a Pluralsight subscription, just go to my list of courses on Pluralsight . At the top is a Try For Free button you can use to get a free 10 day subscription to Pluralsight, with which you can watch my courses, or any other course on the site.

Fun With KQL – MV-Expand

Introduction

In the previous article, Fun With KQL – Make_Set and Make_List, we saw how to get a list of items and return them in a JSON array. In this article we’ll see how to break that JSON array into individual rows of data using the mv-expand operator.

Before we expand our KQL knowledge, be aware that the samples in this post will be run inside the LogAnalytics demo site found at https://aka.ms/LADemo. This demo site has been provided by Microsoft and can be used to learn the Kusto Query Language at no cost to you.

If you’ve not read my introductory post in this series, I’d advise you to do so now. It describes the user interface in detail. You’ll find it at https://arcanecode.com/2022/04/11/fun-with-kql-the-kusto-query-language/.

Note that my output may not look exactly like yours when you run the sample queries for several reasons. First, Microsoft only keeps a few days of demo data, which are constantly updated, so the dates and sample data won’t match the screen shots.

Second, I’ll be using the column tool (discussed in the introductory post) to limit the output to just the columns needed to demonstrate the query. Finally, Microsoft may make changes to both the user interface and the data structures between the time I write this and when you read it.

A Reminder – Make_Set

Before we look at mv-expand, let’s take a quick reminder of make_set from the previous post.

Here Perf was piped into a where operator to limit the results.

We then used make_set to get a list of all the computers from the data that was piped in. It created a JSON array and stored it in the new Computers column. The make_set function created a list of unique computers, so each one from the dataset being piped in only appears once in the JSON array, no matter how many times it was in the incoming dataset.

MV-Expand Basics

Having a JSON array is nice, but what if we really want a dataset of individual rows, where each item from the JSON array appears in a row? As you may have guessed by now, the mv-expand operator can do this for us.

We take the same query as before, and pipe it into the mv-expand operator. We specify the column holding the JSON array.

From here, mv-expand does its thing, and converts each item in the JSON array into individual row. It uses the same name as the original column for the new on, Computers.

As you can see, mv-expand can be very useful for transforming JSON columns into easily usable rows.

See Also

The following operators, functions, and/or plugins were used or mentioned in this article’s demos. You can learn more about them in some of my previous posts, linked below.

Fun With KQL – Make_Set and Make_List

Fun With KQL – Summarize

Fun With KQL – Where

Conclusion

This post explored the useful mv-expand operator. With it you can extract the contents of a JSON array and pivot them into individual rows in a dataset. We also saw how it works nicely with the make_set and make_list functions.

The demos in this series of blog posts were inspired by my Pluralsight courses Kusto Query Language (KQL) from Scratch and Introduction to the Azure Data Migration Service, two of the many courses I have on Pluralsight. All of my courses are linked on my About Me page.

If you don’t have a Pluralsight subscription, just go to my list of courses on Pluralsight . At the top is a Try For Free button you can use to get a free 10 day subscription to Pluralsight, with which you can watch my courses, or any other course on the site.

Fun With KQL – Make_Set and Make_List

Introduction

In previous posts, I’ve mentioned using certain functions and operators to investigate conditions in your system. Naturally you’ll need to create lists of those items, based on certain conditions.

For example, you may want to get a list of the counters associated with an object. Or, you may want to get a list of computer where a certain condition is met.

In this article we’ll see how to get those lists using the Kusto make_set and make_list functions.

The set of samples in this post will be run inside the LogAnalytics demo site found at https://aka.ms/LADemo. This demo site has been provided by Microsoft and can be used to learn the Kusto Query Language at no cost to you.

If you’ve not read my introductory post in this series, I’d advise you to do so now. It describes the user interface in detail. You’ll find it at https://arcanecode.com/2022/04/11/fun-with-kql-the-kusto-query-language/.

Note that my output may not look exactly like yours when you run the sample queries for several reasons. First, Microsoft only keeps a few days of demo data, which are constantly updated, so the dates and sample data won’t match the screen shots.

Second, I’ll be using the column tool (discussed in the introductory post) to limit the output to just the columns needed to demonstrate the query. Finally, Microsoft may make changes to both the user interface and the data structures between the time I write this and when you read it.

Older Names – MakeSet and MakeList

Before I start, let me mention there are older versions of these functions, makeset and makelist. They were renamed to fall in line with revised Kusto naming standards, adding the underscore into the name.

While the old versions still work, you should use the newer version of the names in case Microsoft should phase them out in the future.

Make_Set Basics

For our first example, let’s see how to get a set of items, associated with another item. In this query, we’ll get a list of counter names associated with an object name.

We take the Perf table and pipe in into the summarize operator. A new column name is declared, Counters. We then use make_set, passing in the CounterName column. After the by, we use ObjectName.

This will result in Counters holding a JSON array of CounterNames associated with an ObjectName.

If you look at the output, the second row for the ObjectName of Memory as been expanded. In the Counters column you see a JSON array holding two values, Available MBytes and Available MBytes Memory.

Simply put, the Memory object has two counter names associated with it, Available MBytes and Available MBytes Memory.

Making a Set Based on a Condition

A second, and slightly more useful way to use make_set is to get a list of items where a condition is true.

In this example we again turn to the Perf table. We use a where operator to limit the results to our % Free Space counters where its value is greater than 95 (i.e. 95%).

As before, we go into a summarize operator, creating a new column Computers. We call make_set and pass in the Computer column.

Note that for this query we didn’t use the by portion. In this case, make_set takes the data in the Computer column creates a JSON array, as you can see in the output. This gave us a set of three computers who have more than 95% free space.

Make_List Basics

The second way to create these sets is the make_list function. It works almost identically to make_set, with one minor difference. Let’s see the query in action, and that difference will become clear.f

This query is identical to the one for make_set, except of course for using make_list. However, look at the results.

You’ll see the first computer, SQL01.na.contosohotels.com appears twice in the list. Likewise the computers that begin with SQL12 and SQL00 appear multiple times. And that’s just in little bit that is visible!

Now you can see the big difference, make_set creates a unique list of items. Each entry will only appear once in the JSON array. The make_list function performs no such de-duplication. If the item (in this case the computer name) appeared 100 times, it would be in the JSON array 100 times.

Crashing the User Interface

In the previous example, I attempted to click on the arrow beside the Computers in order to expand the list. The user interface came down with a bad case of "fall down go boom". It sat for a while, before just locking up on me.

I finally determined that the JSON array just had too many items to display. Fortunately, there is a way around this.

Both make_set and make_list accept an optional second parameter to indicate the maximum number of items to return.

In this make_list example, after the Computer column I passed in the value of 64. This will limit the number of items in the JSON array to sixty four items.

I could have used any number, honestly I picked 64 because I happened to glance over at my old Commodore 64 sitting on my desk and decided that would be a good number. Computer history is fun!

Now that I had limited my JSON array, I was able to expand the data in the results grid, and could see the duplicated values. Again, both of these functions support the use of the optional parameter, however you are more likely to need it with make_list.

Make_Set_If

In our first example for make_set, before calling it we had a where operator. Part of it limited the results to rows with a counter value greater than 95.

There is an alternative to make_set called make_set_if. With this function we can pass the condition in as a parameter.

Here we still used where to limit the data to the free space percentage counter. But as a second parameter to make_set_if, we pass in a condition of CounterValue >= 95.

We could have included both conditions by surrounding them with parenthesis, such as:

make_set_if(Computer, (CounterName == "% Free Space" and CounterValue >= 95))

However it turned out to be a more efficient to remove the non free space rows first.

And yes, in this version I did use greater than or equal to, instead of just greater than as I did originally, because why not?

Note that make_set_if also supports the parameter to limit the result set size. It becomes the third parameter, as in:

make_set_if(Computer, CounterValue >= 95, 64)

Make_List_If

There is also a make_list_if function.

It behaves like make_set_if, except for not removing duplicated values. In this example I added the third parameter to limit the size of the JSON array to 32 items.

See Also

The following operators, functions, and/or plugins were used or mentioned in this article’s demos. You can learn more about them in some of my previous posts, linked below.

Fun With KQL – Project

Fun With KQL – Summarize

Fun With KQL – Where

Conclusion

In this post we saw how to use the make_set and make_list functions, along with their corresponding make_set_if and make_list_if functions, to get a list of values in a JSON array. These are useful functions for returning a list of items, such as computers, where some condition is true.

The next article in this series will focus on the mv-expand function, which can be used to take the JSON array created by make_set (or make_list) and convert it into rows.

The demos in this series of blog posts were inspired by my Pluralsight courses Kusto Query Language (KQL) from Scratch and Introduction to the Azure Data Migration Service, two of the many courses I have on Pluralsight. All of my courses are linked on my About Me page.

If you don’t have a Pluralsight subscription, just go to my list of courses on Pluralsight . At the top is a Try For Free button you can use to get a free 10 day subscription to Pluralsight, with which you can watch my courses, or any other course on the site.

Fun With KQL – Arg_Max and Arg_Min

Introduction

A very common need in query languages is the ability to extract the maximum and minimum values in a column of data. The Kusto Query Language provides this capability through two functions, arg_max and arg_min. In this post we’ll take a look at these functions.

At a minimum, you need to be aware that the samples in this post will be run inside the LogAnalytics demo site found at https://aka.ms/LADemo. This demo site has been provided by Microsoft and can be used to learn the Kusto Query Language at no cost to you.

If you’ve not read my introductory post in this series, I’d advise you to do so now. It describes the user interface in detail. You’ll find it at https://arcanecode.com/2022/04/11/fun-with-kql-the-kusto-query-language/.

Note that my output may not look exactly like yours when you run the sample queries for several reasons. First, Microsoft only keeps a few days of demo data, which are constantly updated, so the dates and sample data won’t match the screen shots.

Second, I’ll be using the column tool (discussed in the introductory post) to limit the output to just the columns needed to demonstrate the query. Finally, Microsoft may make changes to both the user interface and the data structures between the time I write this and when you read it.

Arg_Max Basics

As its name implies, the arg_max function returns the maximum value within the column passed into it.

In this example, we are going to use the summarize operator to summarize by the CounterName. The value we’ll use in the summarize is the maximum CounterValue, determined using arg_max, for each CounterName.

The first parameter we pass into arg_max is the column we want to find the maximum value for. The second argument is the column or columns to be returned, besides of course the max value of the passed in column. In this example we use an asterisk to return all of the columns piped in from Perf.

We then go into a project, to limit the output to a few columns, then sort them. (In a moment we’ll see how to limit the output of arg_max so we don’t need the project.)

Note in the output it retained the name for the column we are getting the maximum value for, CounterValue. You should consider renaming this column in the output to a name that is more reflective of the true data, such as MaxCounterValue. This could make the output clearer to the end user of your query.

Arg_Max With Columns

In this second example, we have the same basic result as the first query. In this version though, we pass in the few columns we want back.

In addition to CounterValue, we’ll pass in TimeGenerated, Computer, and ObjectName.

You’ll notice in this version we no longer need the project operator to reduce the number of columns. That is taken care of in arg_max. By taking advantage of this feature, you can make your queries more compact.

Arg_Min Basics

The arg_min function behaves identically to arg_max, with the exception of course of returning the minimum value from the passed in column. You can use the asterisk to return all columns or specify columns to be returned.

As such we’ll just demonstrate the summarize version of our query, but you can replicate the query shown in the previous section by using arg_min instead of arg_max.

As you can see, the minimum counter value across most of the data was a zero.

See Also

The following operators, functions, and/or plugins were used or mentioned in this article’s demos. You can learn more about them in some of my previous posts, linked below.

Fun With KQL – Project

Fun With KQL – Sort

Fun With KQL – Summarize

Conclusion

In this article we saw how to perform a common task across query languages, obtaining the maximum and minimum values for a set of data. We did so using the arg_max and arg_min Kusto functions.

The demos in this series of blog posts were inspired by my Pluralsight courses Kusto Query Language (KQL) from Scratch and Introduction to the Azure Data Migration Service, two of the many courses I have on Pluralsight. All of my courses are linked on my About Me page.

If you don’t have a Pluralsight subscription, just go to my list of courses on Pluralsight . At the top is a Try For Free button you can use to get a free 10 day subscription to Pluralsight, with which you can watch my courses, or any other course on the site.